There are a number of different measurements used in the literature to evaluate the effectiveness of website fingerprinting attacks. This post and the next will attempt to cover most of them. We start with the closed-world setting, and then start to make sense of the open world.
Closed-world measurements
As we covered in the previous post on the setting of WF-attacks, the attacker has a list of monitored pages as part of websites. Each time the client visits a page, the goal of the attacker is to classify using a classifier (attack) which page the client visited (if any). For the closed world, per definition, the client visits one page on the list of the monitored page, the question (for the attacker to answer) is just: which one?
The metric for this setting is straightforward: assume that the client visits n pages, how many times did the classifier classify the right page? We specify this as a fraction (or rate), and refer to it as the True Positive Rate (TPR) defined as TPR = TP / n. As an example, below is again a results table from Tao Wang’s PhD thesis, where you can see the TPR for a large number of classifiers in the closed-world setting for different data sets.
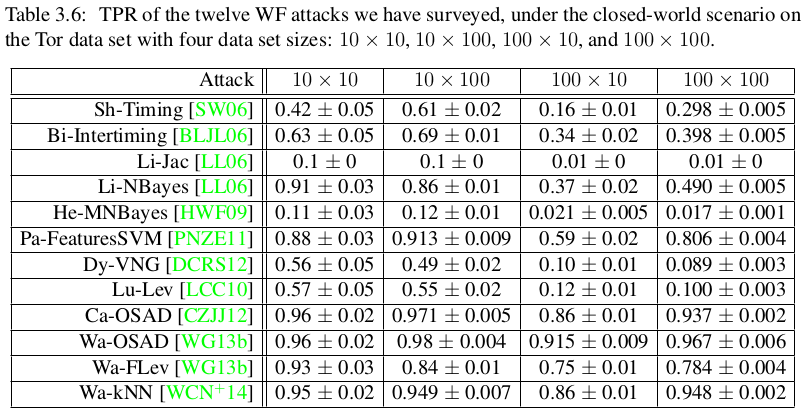
We see, for example, that Wa-kNN has a TPR of 0.95 for a 10 x 10 dataset with a standard deviation of 0.02. The standard deviation is a result of repeating the attack over the data set to get a statistically accurate result (more about that later). The takeaway is that the client visits one out of 10 pages and the Wa-kNN attack will correctly classify the page about 95% of the time.
Open-world measurements
Unfortunately for attackers, we don’t live in a closed-world (no Internet.org yet). The only difference between the open and the closed world for the attacker is that the client can visit pages that are not on the monitored list. This means that the classifier has to be able to identify one more class of pages: the non-monitored class.
Collecting data sets
When performing experiments in the open world, researchers do the following: first, like in the closed world, they define the number of monitored pages and how many instances of each monitored page should be considered. This gives us a total of monitored pages x instances elements in the dataset where the classifier has one class per monitored page but can train on many instances per page. To account for the open world, there are then also a number of non-monitored pages used for both training and testing with some important restrictions:
- there is only one instance per non-monitored page,
- the attacker can never train on a non-monitored page that is part of the testing set, and
- the number of non-monitored pages are limited to some fixed size.
This gives us a total of monitored pages x instances + non-monitored pages elements to collect, where part of the non-monitored pages are used for training and the other for testing.
Measurements
To explain the measurements, we’re going to take a classifier-centric approach and some doodling on paper. For testing a classifier, we have P positive elements (client visits) and N negative elements. In total there are P + N elements (visits by the client to pages). By “positive” we mean when the client visits a monitored page, and by “negative” we mean when the client visits a non-monitored page. Each classification of the classifier is either true or false: true if the classification is correct (the correct class), otherwise false.
Starting from the top of the figure below, the client visits a page (element) and the classifier outputs a classification. Assume the classifier outputs the class representing all non-monitored pages, i.e., the classifier says “the page is a non-monitored page”. In this case we have two outcomes: either the page is a monitored page, or it’s a non-monitored page. If the classifier was correct and it’s a non-monitored page, then we say that the classifier’s output is a true negative (TN). Conversely, if it was a monitored page, then the classifier’s output is a false negative (FN).
Now let’s say that the classifier outputs a class representing a monitored page. First, we have to distinguish between if the page was really a monitored or non-monitored page. If it was a non-monitored page, so the classifier was wrong, we say that the classifier’s output is a false negative-to-positive (FNP). The next case is if it was a monitored page the client visited. The final consideration we have to make is if the classifier’s output is the correct class (page). If it is the wrong class, then we say that the classifier’s output is a false positive-to-positive (FPP). Finally, if the classifier classified the page as the correct class, we say that this is a true positive (TP), like in the closed world. Bear with me, this makes more sense soon.

Based on the above, we define the True Positive Rate (TPR) and False Positive Rate (FPR) for the open-world setting as TPR = TP / monitored elements and FPR = FP / non-monitored elements. While we defined TP earlier as the number of correct classifications for monitored pages above, the other parts are defined as follows:
monitored elements = TP + FN + FPP. In other words, the number of monitored pages are equal to the cases when the classifier either guesses correct (TP), guesses non-monitored wrongly (FN) or guesses the wrong page for a monitored page (FPP).non-monitored elements = TN + FNP. In other words, the number of non-monitored pages are equal to the cases when the classifier either guesses correctly for a non-monitored page (TN) or guesses wrongly that the page is on the monitored list (FNP).FP = FPP + FNP. In other words, the number of false positives are equal to the cases when the classifier either guesses the wrong page for a monitored page (FPP) or guesses wrongly that a non-monitored page is monitored (FNP).
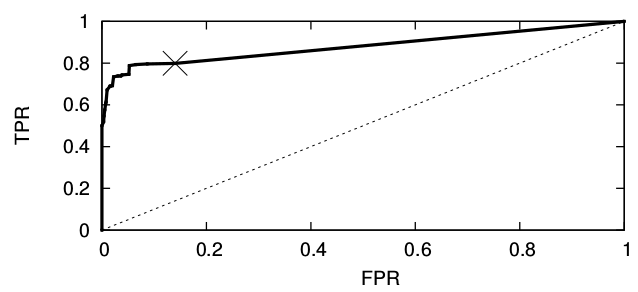
TPR captures the probability that an access to a monitored page is correctly detected. FPR captures the probability of false alarms. Below is an example receiver operating characteristic (ROC) curve that shows the relationship between TPR and FRP for some attack. The dashed line shows the result of a classifier that randomly guesses if a page has a particular class or not with some probability, independent of the input. The cross, around 0.8 TPR and 0.15 FPR, shows the maximum TPR found in some experiment for the attack. We can draw a straight ROC line as part of the ROC curve from that point to the upper right corner, since the attacker can always start guessing from that point on, trading increased FPR for a higher TPR. The goal of an attack, in general, is to maximize TPR and minimise FPR.
While the TPR and FPR metrics are widely used to determine the effectiveness of WF-attacks, it gets more complicated once you consider a reasonable size of the open world. This is the topic of the next post.
Sources
- The table, core measurement definitions, and the ROC curve with example are all from Tao Wang’s PhD thesis.